At FP Block, we are always looking for ways to optimize and improve our deployment processes. For both our internal projects and our clients, we typically leverage the three major cloud providers: AWS, GCP, and Azure. We also extensively use Cloudflare for services like DNS, DDoS protection, and Cloudflare Pages for client-side rendered applications that use WebAssembly (WASM), or for static HTML pages.
However, specific project requirements have led us to explore the potential of bare metal servers. This post is an experience report on our journey of setting up a Kubernetes cluster on bare metal, detailing our objectives, technology choices, and the architecture we designed.
Objective
Our primary goals for this project were clear from the outset:
- Cost-Effectiveness: A major motivation for exploring bare metal was to reduce infrastructure costs compared to major cloud providers.
- High Availability (HA): The platform needed to be resilient and highly available to support production workloads.
- Simplicity: We aimed for a setup that was straightforward to install, maintain, and update.
- Security: The entire stack had to be secure by design.
We needed a robust platform for deploying our applications. Given our extensive experience with Kubernetes (k8s) and its strong community support, it was a natural choice. We specifically opted for k3s, a lightweight Kubernetes distribution, as it is known for its simplicity and ease of installation and management.
Tech Stack
Based on our objectives, we selected the following technology stack:
- Bare Metal Servers: We chose OVHcloud for their competitive pricing and availability of bare metal servers.
- Kubernetes Distribution: As mentioned, we went with k3s, a lightweight and certified Kubernetes distribution perfect for environments where simplicity is key.
- Load Balancer: To manage HTTP/HTTPS traffic and distribute it across our nodes, we decided to set up a dedicated load balancer in front of the cluster.
Architecture
Coming from a background with extensive AWS experience, our initial architectural design was heavily influenced by the patterns we were familiar with. Our plan was to:
- Establish a Private Network: All servers would be connected through a private network (vRack in OVHcloud's terminology) to ensure secure communication between them.
- Isolate Kubernetes Components: The Kubernetes control plane and data plane components would reside entirely within this private network, inaccessible from the public internet.
- Use a Load Balancer for Ingress: A public-facing load balancer would act as the single entry point for all incoming traffic, which it would then distribute to the appropriate services running on the worker nodes.
Infrastructure Provisioning
With a high-level architecture in place, it was time to bring it to life. My goal was to use a declarative setup wherever possible, primarily using Terraform (or its open-source fork, OpenTofu) and Kubernetes manifests. This approach ensures the infrastructure is reproducible, version-controlled, and easier to manage over time.
Provisioning the Bare Metal Servers
We first needed to set up control plane nodes. For that, we had to order some bare metal nodes. This was what my Terraform code looked like:
resource "ovh_dedicated_server" "k3s_one" {
  ovh_subsidiary = data.ovh_me.account.ovh_subsidiary
  display_name = "k3s-one"
  os           = "ubuntu2404-server_64"

  customizations = {
    ssh_key = file("${path.module}/ovh_cloud.pub")
  }

  rescue_ssh_key = file("${path.module}/ovh_cloud.pub")
  plan = [
    {
      plan_code    = "26risele01-v1"
      duration     = "P1M"
      pricing_mode = "default"

      configuration = [
        {
          label = "dedicated_datacenter"
          value = "bhs"
        },
        {
          label = "dedicated_os"
          value = "none_64.en"
        },
        {
          label = "region"
          value = "bhs"
        }
      ]
    }
  ]
}
It took some trial and error to determine the correct plan_code. The
process was not straightforward, requiring me to inspect the DOM on
their Dedicated Server pricing page to find it. Customer support also
pointed me to their API control center as another way to find this
information.
When I ran terraform apply, the process timed out after an hour. This
was because the Terraform resource creates a server order with
OVHcloud, which can take 24-48 hours to process. The provider
implementation blocks until the server is delivered instead of returning
an order ID, which caused the timeout.
After the server was delivered, running terraform plan would show a plan
to place another order. I resolved this by manually importing the
provisioned server into my Terraform state:
import {
  to = ovh_dedicated_server.k3s_one
  id = "server-12345.dedicated.ovh.us"
}
After importing, I had to comment out several attributes in the original resource to prevent Terraform from detecting a drift. Overall, the provisioning experience for bare metal servers via Terraform was less streamlined than with major cloud providers, requiring some manual intervention and workarounds.
I repeated this process for two more servers, giving me a total of three bare metal servers for our high-availability (HA) setup.
Private Network (vRack)
Upon delivery, I was a bit surprised to find that each bare metal server had a public IP address by default. Because each bare metal was exposed to the internet, this meant a slight departure from our original architecture, where we wanted our entire control plane and data plane in a private network. Unfortunately, there was no way to prevent this without changing it from within the OS. Instead, I decided to embrace it, as I'll explain in the Load Balancer section. My goal was still to ensure all k3s control plane and data plane communication happened over a private, isolated network. This was where OVHcloud's vRack private network came in.
The Terraform experience for ordering the vRack was similar to the
dedicated server. After applying the Terraform configuration, I had to
wait a couple of hours for the order to be fulfilled. And, similar to the
dedicated server resource, I had to import the vRack after it was
provisioned. I also had to comment out the plan section to prevent
Terraform from placing a new order. My code looked like this:
resource "ovh_vrack" "vrack" {
  ovh_subsidiary = data.ovh_me.account.ovh_subsidiary
  name           = "k3s"
  description    = "k3s vrack"

 plan {
    duration     = data.ovh_order_cart_product_plan.vrack.selected_price.0.duration
    plan_code    = data.ovh_order_cart_product_plan.vrack.plan_code
    pricing_mode = data.ovh_order_cart_product_plan.vrack.selected_price.0.pricing_mode
  }
}

import {
  to = ovh_vrack.vrack
  id = "vrack-12345"
}
Adding the dedicated server instances to the vRack worked as expected:
resource "ovh_vrack_dedicated_server_interface" "k3s_one" {
  service_name = ovh_vrack.vrack.service_name
  interface_id = data.ovh_dedicated_server.k3s_one.enabled_vrack_vnis[0]
}

resource "ovh_vrack_dedicated_server_interface" "k3s_two" {
  service_name = ovh_vrack.vrack.service_name
  interface_id = data.ovh_dedicated_server.k3s_two.enabled_vrack_vnis[0]
}

resource "ovh_vrack_dedicated_server_interface" "k3s_three" {
  service_name = ovh_vrack.vrack.service_name
  interface_id = data.ovh_dedicated_server.k3s_three.enabled_vrack_vnis[0]
}
Load Balancer
And finally, we needed a load balancer. It serves two purposes:
- To have a stable interface for our applications. We wanted our k3s nodes to be flexible: we might add more nodes based on demand etc, and we wanted a consistent IP or DNS entry to target.
- To be able to apply arbitrary DDoS protection, etc., on it.
I initially provisioned a load balancer from OVHcloud. They offer two tiers:
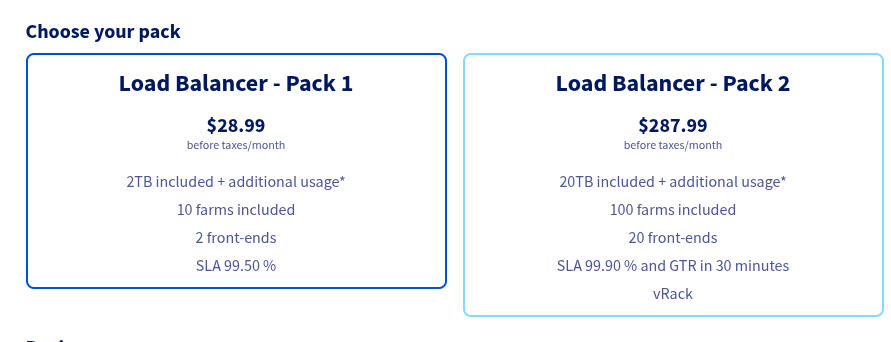
I chose the first option due to its lower cost, but soon discovered it lacked vRack integration. This was a deal-breaker, as my architecture required the load balancer to forward traffic to my nodes over the private network. This led me to explore other options, but not before grappling with OVHcloud's Terraform provider for their load balancer.
The provider's behavior for applying changes was not immediately
obvious. While load balancer resources defined in Terraform appear in the
OVHcloud UI, they are not actually applied until you also add an
ovh_iploadbalancing_refresh resource, a detail that took some time to
uncover.
The combination of the pricing for vRack integration and the quirks in the Terraform workflow led me to look for alternatives. Given that each node had a public IP, it gave us the freedom to integrate with third-party load balancers. This wouldn't have been possible if the bare metal nodes weren't public by default, and this flexibility opened up a lot of options. Since we were already using Cloudflare for DNS, their Load Balancer service was a natural fit. It turned out to be superior in every aspect: cost, ease of use, and quality of the Terraform provider.
In Cloudflare's terminology, the backend servers that handle traffic are called "origins." For our setup, the public IP of each bare metal node served as an origin. Adding additional origins was inexpensive. A load balancer backed by our three bare metal nodes would cost only $10 USD per month. This also gave us access to Cloudflare's robust notification system, which could alert us via email or webhooks if a node became unhealthy.
The Terraform configuration for the Cloudflare Load Balancer looked like this. First, a pool of origin servers:
resource "cloudflare_load_balancer_pool" "k3s_pool" {
  account_id = var.cloudflare_account_id
  name       = "k3s-pool"
  origins = [
    {
      address = "203.0.113.10"
      enabled = true
      name    = "k3s-one"
      port    = 443
      weight  = 1.0
    },
    {
      address = "203.0.113.11"
      enabled = true
      name    = "k3s-two"
      port    = 443
      weight  = 1.0
    },
    {
      address = "203.0.113.12"
      enabled = true
      name    = "k3s-three"
      port    = 443
      weight  = 1.0
    },
  ]
  minimum_origins = 2
  enabled         = true
  monitor         = cloudflare_load_balancer_monitor.lb_tcp_monitor.id
  description     = "k3s cluster on OVHcloud"
}
With the pool defined, creating the load balancer itself was straightforward:
resource "cloudflare_load_balancer" "k3s_lb" {
  name          = "cluster.your-domain.com"
  zone_id       = var.cloudflare_zone_id
  fallback_pool = cloudflare_load_balancer_pool.k3s_pool.id
  default_pools = [cloudflare_load_balancer_pool.k3s_pool.id]
  proxied       = true
}
And the nice thing was that we could also use the Cloudflare infrastructure to set up notifications in case one of the nodes had issues. In this case, I used a TCP health check, but it can also use HTTP/HTTPS checks or various other protocols that Cloudflare supports:
resource "cloudflare_load_balancer_monitor" "lb_tcp_monitor" {
  account_id       = local.account_id
  allow_insecure   = null
  consecutive_down = 3
  consecutive_up   = 3
  description      = "K3s master node one"
  expected_body    = null
  expected_codes   = null
  follow_redirects = null
  header           = null
  interval         = 60
  method           = "connection_established"
  path             = null
  port             = 443
  probe_zone       = null
  retries          = 0
  timeout          = 2
  type             = "tcp"
}

resource "cloudflare_notification_policy" "notify" {
  account_id  = local.account_id
  name        = "LB Pool Unhealthy TCP Alert"
  description = "Policy for OVHcloud k3s Notification"
  enabled     = true

  # The type of alert to send.
  alert_type = "load_balancing_health_alert"

  # The destination for the alert
  mechanisms = {
    email = [
      {
        id = "[email protected]"
      }
    ]
  }

  filters = {
    pool_id = [
      cloudflare_load_balancer_pool.k3s_pool.id
    ]
    new_health = ["Unhealthy", "Healthy"]
  }
}
The experience with the Cloudflare terraform provider, in contrast, was much better. It was well-documented, behaved predictably, and was straightforward to work with.
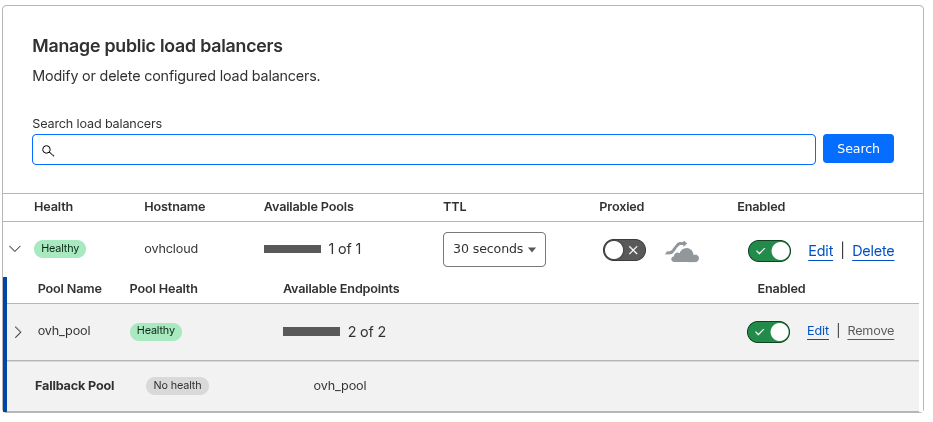
You can confirm that the load balancer has been created by checking the Cloudflare dashboard.
Node and Cluster Configuration
Okay, now that our infrastructure was ready, the final piece was to install and configure k3s. For a high-availability setup, we needed at least three control plane nodes. We decided to use the embedded etcd data store that comes with k3s, though it also supports external databases like PostgreSQL. The official documentation has more details on this.
We had three nodes for our control plane:
| Node name | Public IP | Role |
|---|---|---|
| k3s-one | 203.0.113.10 | Control plane |
| k3s-two | 203.0.113.11 | Control plane |
| k3s-three | 203.0.113.12 | Control plane |
Operating System
The choice of operating system was between Ubuntu and NixOS. NixOS would have fit well with the idea of having a declarative setup. Its k3s integration seemed decent. Ultimately, I decided for the time being to use Ubuntu because:
- I wouldn't need to update the operating system every 6 months since NixOS is a rolling release distribution. That being said, upgrades in NixOS are usually easy. This was a hard sell when compared to Ubuntu's LTS edition.
- NixOS is a second citizen in OVHcloud: Installing Ubuntu is trivial as it is natively supported. With NixOS, I would have to use something like a third party installer script and do additional work myself to get it working.
- Debugging: While NixOS can be predictable when everything works, debugging can be challenging when you stray from the happy path. My experience, after using it for over five years, is mixed.
- Learning curve: I knew that at some point, the cluster would be maintained by other engineers on our team. And I saw it as a hard sell if the engineers aren't invested into Nix already.
Configuring Node Networking
We previously saw the public IPs for our nodes. Now we needed to configure their private networking:
- All k3s control plane and data plane communication had to happen over the private vRack network.
- We needed to assign a static private IP address to each node. The final mapping looked like this:
| Node name | Public IP | Private IP |
|---|---|---|
| k3s-one | 203.0.113.10 | 10.0.0.10 |
| k3s-two | 203.0.113.11 | 10.0.0.11 |
| k3s-three | 203.0.113.12 | 10.0.0.12 |
Since we were using Ubuntu, this could be configured with Netplan. On each
node, I created a configuration file under /etc/netplan (this example
is for k3s-two):
network:
  version: 2
  ethernets:
    enp3s0f1np1: # Private vRack interface
      dhcp4: no
      addresses: [10.0.0.11/24] # Assign a static IP
And then apply those changes:
sudo netplan apply
HAProxy and Keepalived
HAProxy and Keepalived played a major part in the HA nature of the k3s control plane.
- HAProxy: Acts as a local TCP load balancer for the Kubernetes API
server. It runs on each node and performs health checks. If one of
the
k3smaster processes becomes unhealthy, HAProxy will stop sending traffic to it.
I installed HAProxy on all three nodes and used the following
configuration in /etc/haproxy/haproxy.cfg. On each node, the bind
address should be set to its local private IP. The example below was
for k3s-one:
frontend k3s-api
    bind 10.0.0.10:6443
    mode tcp
    default_backend k3s-api-backend

backend k3s-api-backend
    mode tcp
    balance roundrobin
    option tcp-check
    # Add all your control plane nodes here
    server k3s-one   10.0.0.10:6443 check
    server k3s-two   10.0.0.11:6443 check
    server k3s-three 10.0.0.12:6443 check
- Keepalived: Manages a single, "floating" virtual IP address (VIP) that can move between servers. It ensures that the VIP is always assigned to a healthy node, providing a stable endpoint for the Kubernetes API.
For Keepalived, the configuration was slightly different on each node
(mainly the priority). This example for k3s-one went in
/etc/keepalived/keepalived.conf:
vrrp_instance VI_1 {
    state MASTER          # Set to BACKUP on other nodes
    interface enp1s0f1    # Your vRack network interface
    virtual_router_id 51
    priority 101          # Use a lower priority on other nodes (e.g., 100)

    advert_int 1
    authentication {
        auth_type PASS
        auth_pass "your_secret_password" # Use the same password on all nodes
    }

    virtual_ipaddress {
        10.0.0.100/24     # Your VIP
    }
}
For the other nodes, you'll need to adjust fields like state,
interface, and priority. The state should be BACKUP and the
priority must be a lower value than the master node's. Here is a
sample configuration for another node:
vrrp_instance VI_1 {
    state BACKUP
    interface enp3s0f1np1    # Your vRack network interface
    virtual_router_id 51
    priority 100          # Lower priority (use 99 on the next node)

    advert_int 1
    authentication {
        auth_type PASS
        auth_pass "your_secret_password" # Use the same password on all nodes
    }

    virtual_ipaddress {
        10.0.0.100/24  # Your VIP
    }
}
Make sure to restart both the services:
sudo systemctl restart haproxy
sudo systemctl restart keepalived
K3s installation
I downloaded the installer script and committed it to the DevOps repository so that it could be used for all the nodes:
curl -sfL https://get.k3s.io -o ./bin/install.sh
Next, I constructed the first k3s config.yaml configuration for the first node:
cluster-init: true

# --- Node-Specific Configuration ---
# You MUST change these values on each server node.
bind-address: 10.0.0.10 # <-- Use this node's unique vRack IP
node-ip: 10.0.0.10      # <-- Use this node's unique vRack IP
flannel-iface: enp1s0f1 # Your vRack network interface

# --- Common Cluster Configuration ---
# These values will be identical on all nodes
write-kubeconfig-mode: "0644"
https-listen-port: 6443
token: "a-very-secret-and-secure-token"

tls-san:
  - 10.0.0.100 # <-- Your Keepalived VIP

disable:
- servicelb
- traefik
The flannel-iface field is particularly important; it tells Flannel,
the default CNI (Container Network Interface) in k3s, which network
interface to use for pod-to-pod communication. By setting this to our
vRack's private network interface, we ensured that all cluster
networking traffic stayed within our isolated network. Most of the other
fields are self-explanatory or can be found in the official k3s
documentation.
The cluster-init option tells k3s to initialize a new cluster using
its embedded etcd. The configuration for the other nodes was similar,
but without cluster-init. Instead, they would join the existing
cluster using the VIP as the server address. For example, here is the
configuration for k3s-two:
# --- Node-Specific Configuration ---
# You MUST change these values on each server node.
bind-address: 10.0.0.11 # <-- Use this node's unique vRack IP
node-ip: 10.0.0.11      # <-- Use this node's unique vRack IP
server: https://10.0.0.100:6443       # <-- The VIP to join
flannel-iface: enp3s0f1np1 # Your vRack network interface

# --- Common Cluster Configuration ---
# These values will be identical on all nodes
write-kubeconfig-mode: "0644"
https-listen-port: 6443
token: "a-very-secret-and-secure-token"

tls-san:
  - 10.0.0.100 # <-- Your Keepalived VIP

disable:
- servicelb
- traefik
And this was how I installed it on my nodes:
env K3S_CONFIG_FILE="/home/ubuntu/whatever_path/node-one.yaml" ./install.sh
What the install.sh script does is that it downloads the binaries and
starts a systemd service for k3s. You can check its status after the installation by
systemctl status k3s.service
Once the installation was successful on all nodes, kubectl get nodes showed the full cluster:
$ k3s kubectl get nodes
NAME        STATUS   ROLES                  AGE   VERSION
k3s-one     Ready    control-plane,master   15m   v1.33.6+k3s1
k3s-two     Ready    control-plane,master   12m   v1.33.6+k3s1
k3s-three   Ready    control-plane,master   10m   v1.33.6+k3s1
If you want to add a data plane node (also known as a worker or agent
node) that only runs your application workloads and doesn't participate
in the control plane, the process is very similar. The main difference
is a simpler config.yaml. A worker node doesn't run the API server,
so its configuration omits control-plane-specific options. Here is a
sample configuration for a worker node:
# config.yaml for a worker node

# --- Node-Specific Configuration ---
node-ip: 10.0.0.13      # <-- Use this node's unique vRack IP
server: https://10.0.0.100:6443       # <-- The VIP to join
flannel-iface: enp4s0f0 # Your vRack network interface for this node

# --- Common Cluster Configuration ---
token: "a-very-secret-and-secure-token"
Notice that this configuration is much shorter. It doesn't include
bind-address, https-listen-port, tls-san, or the disable list,
as those are all related to control plane components. You would use the
same install.sh script to provision the node, and it would
automatically join the cluster as a worker.
Security
Securing the cluster is critical. The primary vulnerability in this setup
is that an attacker could bypass Cloudflare's protection by discovering
the public IP addresses of the bare metal servers and sending requests
directly to them. For example, after deploying an application to
app.your-domain.com, I could access it by targeting a node's public
IP, completely bypassing services like DDoS protection and rate limiting.
This can be easily tested:
$ curl -w "%{http_code}\n" -o /dev/null -k \
  -H "Host: app.your-domain.com" \
  https://203.0.113.10
200
The successful 200 response confirmed that our origin server was
accessible directly, which is a security risk.
The solution: Authenticated Origin Pulls
To mitigate this, we can use Cloudflare's Authenticated Origin Pulls feature, which uses mutual TLS (mTLS) to ensure that our origin servers only accept traffic that comes from Cloudflare's network.
The implementation involved three steps:
1. Configure Cloudflare
First, I set the zone's SSL/TLS encryption mode to "Full (Strict)" to ensure end-to-end encryption. This was a prerequisite for Authenticated Origin Pulls.
resource "cloudflare_zone_settings_override" "ssl" {
  zone_id = var.cloudflare_zone_id
  settings {
    ssl = "strict" # Options: "off", "flexible", "full", "strict"
  }
}
Then, I enabled Authenticated Origin Pulls for the zone:
resource "cloudflare_authenticated_origin_pulls" "origin_pulls_settings" {
  zone_id = var.cloudflare_zone_id
  enabled = true
}
You can verify this is enabled in the Cloudflare dashboard under "SSL/TLS" -> "Origin Server":

2. Configure the Ingress Controller
Enabling the setting in Cloudflare is not enough. You must also
configure your ingress controller to require and verify the client
certificate that Cloudflare now presents with each request. In my
case, using the Traefik ingress controller, this required creating a
TLSOption resource:
apiVersion: traefik.io/v1alpha1
kind: TLSOption
metadata:
  name: require-cloudflare-client-cert
  namespace: base-app
spec:
  clientAuth:
    secretNames:
    - cloudflare-orgin-pull
    clientAuthType: RequireAndVerifyClientCert
And then referencing this TLSOption in my application's IngressRoute:
apiVersion: traefik.io/v1alpha1
kind: IngressRoute
metadata:
  name: my-app
  namespace: base-app
  annotations:
    external-dns.alpha.kubernetes.io/target: "cluster.your-domain.com"
    external-dns.alpha.kubernetes.io/cloudflare-proxied: "true"
spec:
  entryPoints:
    - websecure
  routes:
    - match: Host(`app.your-domain.com`)
      kind: Rule
      services:
        - name: httpbin
          port: 80
  tls:
    secretName: your-domain-com-tls
    options:
      name: require-cloudflare-client-cert
      namespace: base-app
I would recommend making this TLSOption the default for all ingresses
to ensure all applications are protected.
3. Verify the fix
With these changes in place, the direct request to the server's public IP now failed, as expected:
$ curl -w "%{http_code}\n" -o /dev/null -k \
  -H "Host: app.your-domain.com" \
  https://203.0.113.10
421
The 421 status code indicated that the server was not configured to
handle the request for that domain, which was exactly what we wanted.
Hardening the nodes
With the primary vulnerability addressed, there were a few more steps to harden the nodes themselves.
SSH Access
There were three ports that were open in each of these nodes: 22, 80, and 443. The first step was to harden SSH access (port 22) by disabling password-based authentication in favor of public keys. It would also be prudent to restrict SSH access to a specific bastion host or a set of known IP addresses.
Firewall Configuration
My initial approach was to configure the firewall on each node using
nftables. However, I learned the hard way that this was not the right
approach, as it seemed to conflict with the internal traffic rules
managed by the k3s cluster.
A much better solution is to use Kubernetes NetworkPolicy resources.
k3s comes with an embedded network policy
controller,
which allows you to define firewall rules declaratively at the cluster
level. This avoids conflicts and keeps all your configuration within
the Kubernetes ecosystem.
To restrict traffic to the ingress controller to only come from
Cloudflare's IP ranges (found at
cloudflare.com/ips), I created a
NetworkPolicy resource like this. Note that this policy only allows
traffic on port 443. Since we set the SSL/TLS mode to "Full (Strict)"
in Cloudflare, all traffic is encrypted, and port 80 is no longer
needed.
apiVersion: networking.k8s.io/v1
kind: NetworkPolicy
metadata:
  name: traefik-ingress-from-cloudflare
  namespace: kube-system
spec:
  podSelector:
    matchLabels:
      app.kubernetes.io/name: traefik

  # This policy defines ingress (inbound) rules.
  policyTypes:
  - Ingress

  ingress:
  - from:
      # This is a partial list as an example
      # IPv4 Ranges
      - ipBlock:
          cidr: 173.245.48.0/20
      - ipBlock:
          cidr: 103.21.244.0/22

      # IPv6 Ranges
      - ipBlock:
          cidr: 2400:cb00::/32
      - ipBlock:
          cidr: 2606:4700::/32

    ports:
    # Allow traffic on the standard web ports
    - protocol: TCP
      port: 443
Verifying Open Ports
It's good practice to periodically scan your nodes from an external network to confirm which ports are open. I used the RustScan utility for this, and found it to be a nice tool.
To check if port 443 is open on a bare metal node:
$ rustscan -a 203.0.113.10 -p 443
.----. .-. .-. .----..---.  .----. .---.   .--.  .-. .-.
| {}  }| { } |{ {__ {_   _}{ {__  /  ___} / {} \ |  `| |
| .-. \| {_} |.-._} } | |  .-._} }\     }/  /\  \| |\  |
`-' `-'`-----'`----'  `-'  `----'  `---' `-'  `-'`-' `-'
The Modern Day Port Scanner.
________________________________________
: http://discord.skerritt.blog         :
: https://github.com/RustScan/RustScan :
 --------------------------------------
RustScan: Making sure 'closed' isn't just a state of mind.

Open 203.0.113.10:443
[~] Starting Script(s)
[~] Starting Nmap 7.98 ( https://nmap.org ) at 2025-12-16 10:28 +0530
Initiating Ping Scan at 10:28
Scanning 203.0.113.10 [2 ports]
Completed Ping Scan at 10:28, 0.22s elapsed (1 total hosts)
Initiating Parallel DNS resolution of 1 host. at 10:28
Completed Parallel DNS resolution of 1 host. at 10:28, 0.24s elapsed
DNS resolution of 1 IPs took 0.24s. Mode: Async [#: 1, OK: 1, NX: 0, DR: 0, SF: 0, TR: 1, CN: 0]
Initiating Connect Scan at 10:28
Scanning 203.0.113.10 [1 port]
Discovered open port 443/tcp on 203.0.113.10
Completed Connect Scan at 10:28, 0.21s elapsed (1 total ports)
Nmap scan report for 203.0.113.10
Host is up, received syn-ack (0.22s latency).
Scanned at 2025-12-16 10:28:22 IST for 1s

PORT    STATE SERVICE REASON
443/tcp open  https   syn-ack

Read data files from: /nix/store/hil6r8hvx4cmcw4367pkw5jqphf37ijf-nmap-7.98/bin/../share/nmap
Nmap done: 1 IP address (1 host up) scanned in 0.68 seconds
This confirmed that port 443 was open. You can similarly check that the Kubernetes API port wasn't exposed. You can pass a list of ports to check like this:
$ rustscan -a 203.0.113.10 -p 22,80,443,6443
Or can even ask it to search for open ports within a specific range:
$ rustscan -a 203.0.113.10 -r 6000-7000
Tradeoffs
This was a significant amount of work. So, what are the trade-offs compared to using a managed Kubernetes service like EKS or GKE? The key differences can be broken down into four main areas: management overhead, cost, availability, and the Kubernetes distribution itself.
Management Overhead
With a bare metal setup, you are fully responsible for the entire stack. This includes:
- Operating System: You must handle OS updates, security patching, and any OS-level configuration.
- Kubernetes Control Plane: The lifecycle of all Kubernetes components (etcd, API server, etc.) is your responsibility. This includes upgrades, backups, and recovery.
- Networking: While we used vRack for the private network, you are still responsible for configuring it correctly on each node.
In contrast, a managed service like EKS abstracts away the control plane management entirely, allowing you to focus on your applications.
Cost
The primary advantage of this approach is the significant cost savings.
Our Bare Metal Setup
Each of our bare metal nodes had the following configuration:
- RAM: 32 GB ECC
- Data disks: ~2 TB SSD NVMe
- CPU: 6c/12t (AMD Ryzen 5 5600X)
A single machine in the Canada region cost around $56 USD per month. For our three-node cluster, this totaled ~$168 USD. Adding the Cloudflare Load Balancer at $10/month, the total monthly cost was approximately $178 USD.
Equivalent AWS EKS Setup
A direct comparison is difficult as AWS doesn't offer a 6-core machine.
The closest comparable instance is the r6g.xlarge (4 vCPU, 32 GB RAM).
- Nodes: At an on-demand price of ~$160 USD/month per instance, three nodes would cost ~$480 USD.
- EKS Control Plane: EKS adds a fixed fee of ~$72 USD per month.
- Total: This brings the baseline cost to ~$552 USD per month, even for less powerful nodes. This doesn't include variable costs like NAT gateway usage or data transfer fees, which would increase the total further.
The bare metal approach is roughly one-third the cost of a comparable managed EKS cluster.
Availability
This is where managed cloud providers like AWS have a distinct advantage. Pretty much all AWS regions have a minimum of three Availability Zones (AZs), providing a high degree of confidence for fault tolerance.
In comparison, most OVHcloud regions do not have multiple AZs. At the time of writing, only their Paris region offers three AZs, but the available servers are from their more expensive "Scale" line, with starting prices around ~$550 USD per node. While these servers come with a higher CPU specification for that price, the issue is the lack of availability for lower-cost models in their multi-AZ regions.
While we could potentially build a multi-region Kubernetes cluster to mitigate this, it would introduce higher latency and complexity.
Kubernetes Distribution
It's also worth noting that we are comparing different Kubernetes distributions. Our setup used k3s, a lightweight, certified distribution designed for simplicity. Managed services like EKS use the standard, full-featured Kubernetes distribution. For most use cases, k3s is perfectly capable, but it's a factor to consider if your workloads have specific dependencies on features that might differ between the two.
Conclusion
Building a Kubernetes cluster on bare metal is a significant undertaking. We successfully created a highly-available, cost-effective, and secure platform using OVHcloud servers, k3s, and Cloudflare.
The journey highlighted some of the rough edges of bare metal automation, particularly with Terraform providers that don't always offer a smooth, declarative experience. However, by combining different services—using Cloudflare for load balancing and security—we were able to build a robust system that met all our initial objectives.
While a managed Kubernetes service is often the right choice to reduce operational burden, this bare metal approach provides a powerful and significantly cheaper alternative for performance-sensitive workloads or when you need more control over your infrastructure. It requires more upfront investment in time and expertise, but the result is a highly performant and cost-efficient Kubernetes cluster.
If you want production-ready managed Kubernetes clusters, you might be interested in our Kube360 product. Also, if you want a bare metal-based k8s cluster or any kind of DevOps consulting, you can contact us here; we are the experts.
Subscribe to our blog via email
Email subscriptions come from our Atom feed and are handled by Blogtrottr. You will only receive notifications of blog posts,
and can unsubscribe any time.
Do you like this blog post and need help with Next Generation Software Engineering, Platform Engineering or Blockchain & Smart Contracts? Contact us.